Fractal Enterprise Model (FEM) is a model that can be considered in two ways:
- As a presentation of a process architecture as it shows interconnections between the business processes that exists in the same organization
- As a model of an enterprise as besides processes it reveals assets that exists in the organizations and relate them to the processes.
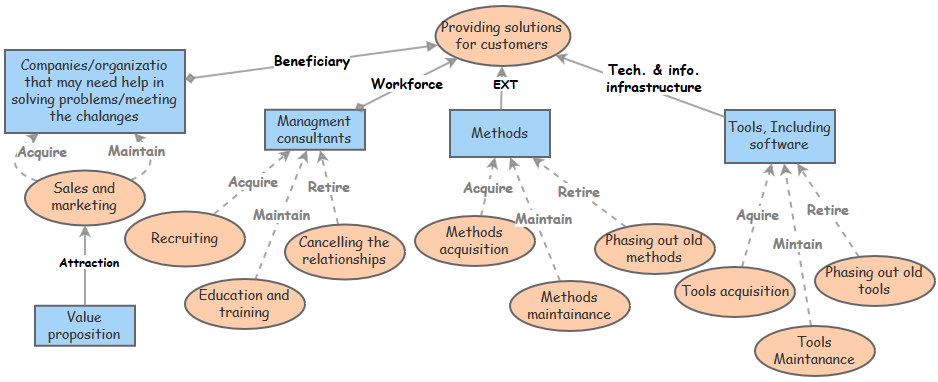
FEM includes three types of elements: business processes (more exactly, business process types), assets, and relationships between them, see Fig. 1, in which a fragment of a model for a management consulting company is presented. Graphically, a process is represented by an oval; an asset is represented by a rectangle (box), while a relationship between a process and an asset is represented by an arrow. We differentiate two types of relationships in the fractal model. One type represents a relationship of a process “using” an asset; in this case, the arrow points from the asset to the process and has a solid line. The other type represents a relationship of a process changing the asset; in this case, the arrow points from the process to the asset and has a dashed line. These two types of relationships allow tying up processes and assets in a directed graph.
In FEM, a label inside an oval names the given process, and a label inside a rectangle names the given asset. Arrows are also labeled to show the type of relationships between the processes and assets. A label on an arrow pointing from an asset to a process identifies the role the given asset plays in the process, for example, workforce, infrastructure, EXecution Template (EXT), etc. A label on an arrow pointing from a process to an asset identifies the way in which the process affects (i.e. changes) the asset. In FEM, an asset is considered as a pool of entities capable of playing a given roles in a given processes. Labels leading into assets from supporting processes reflect the way the pool is affected, for example, a label acquire identifies that the process can/should increase the pool size.
Note that the same asset can be used in two different processes playing the same or different roles in them, which is reflected by labels on the corresponding arrows. It is also possible that the same asset can be used for more than one role in the same process; in this case, there can be more than one arrow between the asset and the process, but with different labels. Similarly, the same process could affect different assets, each in the same or in different ways, which is represented by the corresponding labels on the arrows. Moreover, it is possible that the same process affects the same asset in different ways, which is represented by having two or more arrows from the process to the asset, each with its own label.
Labels inside ovals, which represent processes, and rectangles, which represent assets, are not standardized. They can be set according to the terminology accepted in the given domain, or be specific for a given organization. Labels on arrows, which represent the relationships between processes and assets, however, can be standardized. This is done by using a relatively abstract set of relationships, like, workforce, acquire, etc., which are clarified by the domain- and context-specific labels inside ovals and rectangles. Standardization improves the understandability of the models.
Fig. above shows four main assets needed for the main process of a hypothetical management consulting company: customers (beneficiary), management consultants (workforce), methods (EXT – execution template that guides how process instance of the delivery process are conducted), and tools, e.g. software tools (technical and informational infrastructure). The figure also shows which processes (or group of processes) are needed to have these assets up-to-date, e.g. marketing and sales, recruiting, etc. Note that Fig. 1 not shows all assets that might be needed, for example, a stock of orders.